import matplotlib.pyplot as plt
#
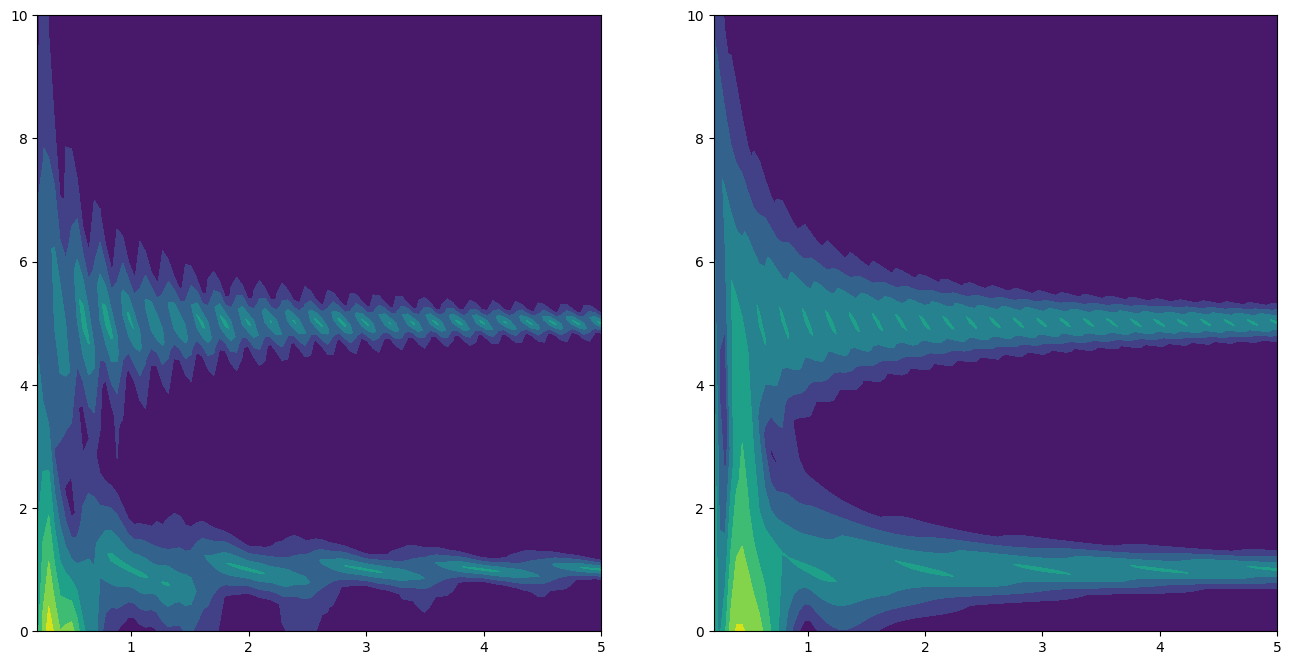
fig, ax = plt.subplots(1,2, figsize=(16,8))
#
for i, iT in enumerate(T):
signal = ft(t*iT)#*np.hanning(nt)
mapf[i,:] = np.abs(np.fft.fft(signal))[0:nt//2]
axef[i,:] = np.fft.fftfreq(signal.size, d=iT/nt)[0:nt//2] # linspace(0, nt/2/iT, nt//2)
axeT[i,:] = iT
ax[0].contourf(axeT, axef, mapf)
ax[0].set_ylim(0, 10.)
#
for i, iT in enumerate(T):
signal = ft(t*iT)*np.hanning(nt)
mapf[i,:] = np.abs(np.fft.fft(signal))[0:nt//2]
axef[i,:] = np.fft.fftfreq(signal.size, d=iT/nt)[0:nt//2] # linspace(0, nt/2/iT, nt//2)
axeT[i,:] = iT
ax[1].contourf(axeT, axef, mapf)
ax[1].set_ylim(0, 10.)